You’re spending hours on LinkedIn every week. Posting content. Sending connection requests. Running ads.
But here’s the uncomfortable truth: most B2B marketers track the wrong LinkedIn metrics.
They obsess over follower counts and post likes. Meanwhile, their competitors are measuring what actually matters—the LinkedIn lead generation metrics that connect directly to revenue.
Here’s something that’ll make you pay attention: LinkedIn drives 80% of B2B social media leads. Companies using the platform generate $312 million in pipeline annually. But only if they’re tracking the right numbers.
Let’s fix that. This guide reveals the exact metrics for LinkedIn lead generation that separate top performers from everyone else.
Why LinkedIn Metrics Matter More Than Ever in 2026
Social selling isn’t optional anymore. It’s the difference between hitting quota and missing it by miles.
LinkedIn reports that social selling leaders create 45% more opportunities than their peers. They’re also 51% more likely to reach their sales targets.
But here’s the catch: you can’t improve what you don’t measure.
Most marketers focus on vanity metrics. Impressions. Profile views. Follower growth. These numbers feel good, but they don’t pay the bills.
The real game-changers? Conversion rates. Cost per lead. Pipeline attribution. These are the LinkedIn KPIs that your CEO actually cares about.
The 3 Types of LinkedIn Metrics You Need to Track
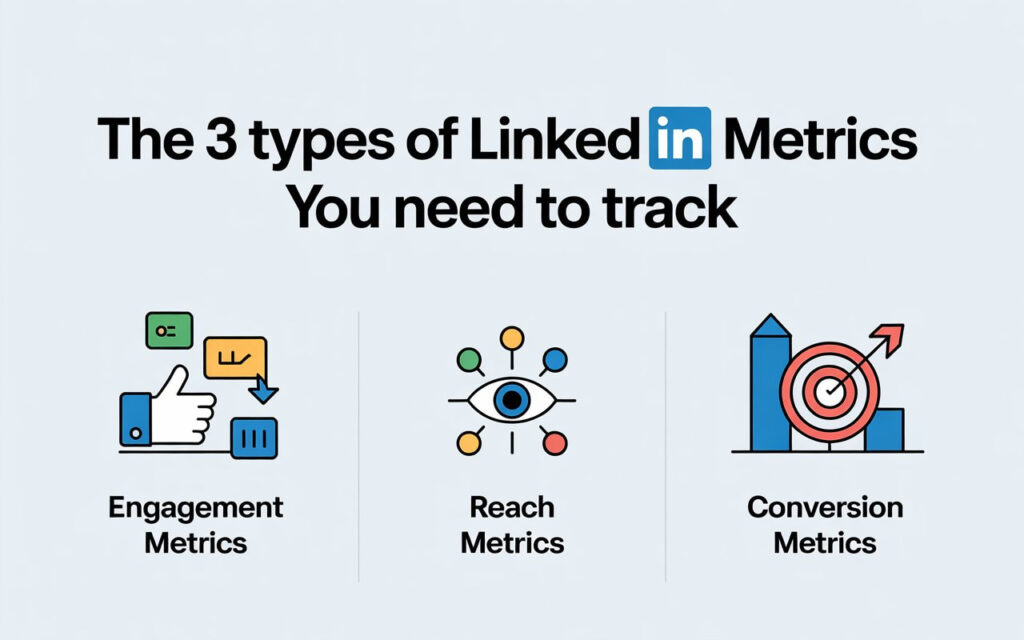
Before we dive deep, let’s organize the chaos. LinkedIn performance metrics fall into three categories.
1. Visibility Metrics show how many people see your content. Think impressions, reach, and profile views.
2. Engagement Metrics measure interactions. Comments, shares, click-through rates, and connection acceptance rates.
3. Conversion Metrics track business results. Lead generation, pipeline value, and revenue attribution.
Most people stop at visibility. Winners focus on conversions.
Essential LinkedIn Lead Generation Metrics to Monitor
Your Social Selling Index (SSI) Score
Your LinkedIn SSI score is the platform’s way of grading your social selling game. It’s a number from 0 to 100 based on four factors.
First, establishing your professional brand. Second, finding the right people. Third, engaging with insights. Fourth, building relationships.
A good SSI score is 70 or above. Top performers hit 75-90. And the data backs up why it matters.
Sales professionals with high SSI scores are 51% more likely to reach quota. They create 45% more opportunities than peers with lower scores.
Check your score weekly at linkedin.com/sales/ssi. Watch which pillar needs work, then optimize that area specifically.
Connection Request Acceptance Rate
This metric tells you if you’re targeting the right people with the right message.
Calculate it simply: (Accepted connections ÷ Total requests sent) × 100.
Personalized requests typically see 30-50% acceptance rates. Generic invites? You’re lucky to hit 10-20%.
If your rate drops below 25%, stop sending requests immediately. Your message isn’t resonating. Your targeting is off. Or both.
Test different opening lines. Reference mutual connections. Mention shared interests. Personalization isn’t optional—it’s the price of entry.
LinkedIn Engagement Rate
Engagement rate measures how your content resonates with your audience. It’s the percentage of people who interact with your posts.
The formula: (Likes + Comments + Shares + Clicks) ÷ Impressions × 100.
Company pages should target 2-5% overall engagement. Large enterprises typically see 1-3%. Smaller businesses can hit 4-8% with personalized content.
Video crushes static images. LinkedIn reports that video posts generate 5x more engagement than text or images. Live video? That’s 24x more engaging.
Post consistently 3-5 times per week. Track which formats perform best. Double down on winners.
InMail and Message Response Rates
After someone accepts your connection, what happens next? Your message reply rate tells the story.
Good performers see 10-20% response rates on follow-up messages. Exceptional sellers hit 25-30% with Sales Navigator InMails.
Low response rates signal several problems. Your message might be too salesy. You’re not providing value upfront. Or you’re messaging the wrong people.
Test different message frameworks. Lead with insights, not pitches. Ask questions instead of making demands. Personalize every single message.
LinkedIn Ads Performance Metrics
Running LinkedIn ads? These numbers determine if you’re printing money or burning it.
Click-through rate (CTR) averages 0.44-0.65% for B2B campaigns. Anything above 0.65% means your creative and targeting are working.
Lead Gen Form completion rates typically hit 10-13%. High performers reach 15% or higher by reducing form fields and matching ad copy to form messaging.
Cost per lead varies wildly by industry. Technology companies might pay $75-150 per lead. Financial services? Expect $200-500. The key is comparing your CPL to your customer lifetime value.
Conversion rates on LinkedIn average 2.5-3.5% for B2B campaigns. That’s significantly higher than most other platforms because of LinkedIn’s professional audience.
Track engagement rate on your ads too. The benchmark is 0.7-1.5%. Higher engagement signals relevance—and LinkedIn’s algorithm rewards you with better reach.
Profile Views and Search Appearances
These visibility metrics show how discoverable you are on LinkedIn.
Profile views indicate interest. If someone’s checking out your profile, they’re researching you. They might be evaluating a purchase. Or considering a partnership.
Track your weekly profile views. Notice spikes? Cross-reference them with your activities. Did a post go viral? Did you comment on an influencer’s content?
Search appearances tell you how often you show up in LinkedIn searches. Optimize your profile with relevant keywords in your headline, about section, and experience.
The more searchable you are, the more inbound opportunities you’ll attract.
Content Performance Metrics
Not all content performs equally. Track what actually drives results.
Post impressions show how many times your content appeared in feeds. Reach measures unique viewers. The gap between them reveals how much your content gets reshared.
Click-through rate on posts matters more than likes. A post with 50 clicks beats one with 500 likes if your goal is lead generation.
Document and carousel posts often outperform basic text updates. They’re more interactive and provide more value in a single swipe.
Track video view rates and completion percentages. Videos under 30 seconds get watched all the way through. Longer videos need hooks every 10 seconds to maintain attention.
Connection-to-Meeting Ratio
This is where the rubber meets the road. How many connections does it take to book one qualified meeting?
Average performers need 400-600 connections per meeting. Top performers book meetings with every 200-300 connections.
Calculate yours: Total connections made ÷ Meetings booked = Your ratio.
A high ratio signals problems in your follow-up sequence. You’re not providing enough value. Your calls-to-action are weak. Or you’re targeting the wrong prospects.
Pipeline Attribution Metrics
The ultimate question: what revenue is LinkedIn actually generating?
Track LinkedIn-influenced pipeline. This includes any deal where LinkedIn played a role—first touch, last touch, or anywhere in between.
Use multi-touch attribution models. LinkedIn rarely closes deals alone. But it often introduces prospects, nurtures relationships, and accelerates sales cycles.
Calculate your LinkedIn ROI: (Revenue generated – LinkedIn costs) ÷ LinkedIn costs × 100.
If you’re spending $5,000 monthly on ads and generating $50,000 in closed revenue, that’s a 900% ROI. That math makes budget conversations very easy.
How to Track These Metrics Effectively
You can’t manage what you don’t measure. But tracking everything manually is impossible.
LinkedIn’s native analytics dashboard provides solid baseline data. Check it weekly for profile views, post performance, and follower demographics.
LinkedIn Campaign Manager gives you detailed ad metrics. Monitor daily spend, conversion rates, and lead quality. Adjust targeting and creative based on performance.
Sales Navigator users get advanced filtering and lead tracking. Save searches, track account insights, and monitor job changes among prospects.
Integrate LinkedIn with your CRM system. HubSpot, Salesforce, and Pipedrive all offer native LinkedIn integrations. This connects social activities to actual deals.
Build a simple weekly dashboard. Track your top 5-7 metrics. Review every Monday. Adjust your strategy based on trends, not daily fluctuations.
Common Mistakes to Avoid
Stop tracking follower count as your primary KPI. It’s meaningless if those followers never engage or convert.
Don’t compare your metrics to B2C brands. Consumer companies naturally get higher engagement. Your 2% engagement rate beats most B2B companies’ 0.5%.
Never optimize for just one metric. High CTR means nothing if your conversion rate tanks. Balance visibility, engagement, and conversions.
Avoid checking metrics daily. LinkedIn’s algorithm takes time to optimize delivery. Weekly reviews reveal actual trends.
Taking Action on Your LinkedIn Metrics
Data without action is just noise. Here’s how to use these metrics strategically.
If your SSI score is below 70, focus on one pillar per month. Improve your profile first. Then optimize your content strategy. Finally, increase engagement consistency.
Low connection acceptance rates? Rewrite your invitation templates. Add personalization tokens. Reference shared connections or interests.
Weak engagement rates? Test different content formats. Video, carousels, and documents typically outperform text-only posts.
High ad spend but low conversions? Audit your landing pages. Simplify your Lead Gen Forms. Test different offers and value propositions.
The Bottom Line
LinkedIn lead generation metrics aren’t just numbers on a screen. They’re your roadmap to predictable revenue growth.
Start with the basics: track your SSI score, engagement rate, and conversion rate. Master those before adding complexity.
Review your metrics weekly. Spot trends early. Double down on what works. Cut what doesn’t.
Remember: LinkedIn drives 277% more leads than Facebook or Twitter for B2B companies. But only if you’re measuring and optimizing the right activities.
The marketers winning on LinkedIn in 2026 aren’t guessing. They’re tracking, testing, and refining based on real performance data.
Your competitors are probably still counting followers. You? You’re about to measure what actually matters.Time to start tracking the metrics that move the needle.