LinkedIn conversion rate benchmarks vary wildly from 1.4% in real estate to 13% with Lead Gen Forms, and most advertisers have no idea where they actually stand.
Spending thousands on LinkedIn ads while comparing yourself to the wrong benchmark is how B2B teams waste entire quarterly budgets.
This guide fixes that. You will find the average LinkedIn conversion rate by ad format, a full industry breakdown from technology to healthcare, the real math behind why LinkedIn beats Facebook on revenue despite lower conversion rates, and 5 proven tactics that lift conversions between 40% and 80% starting this week.
Quick Answer
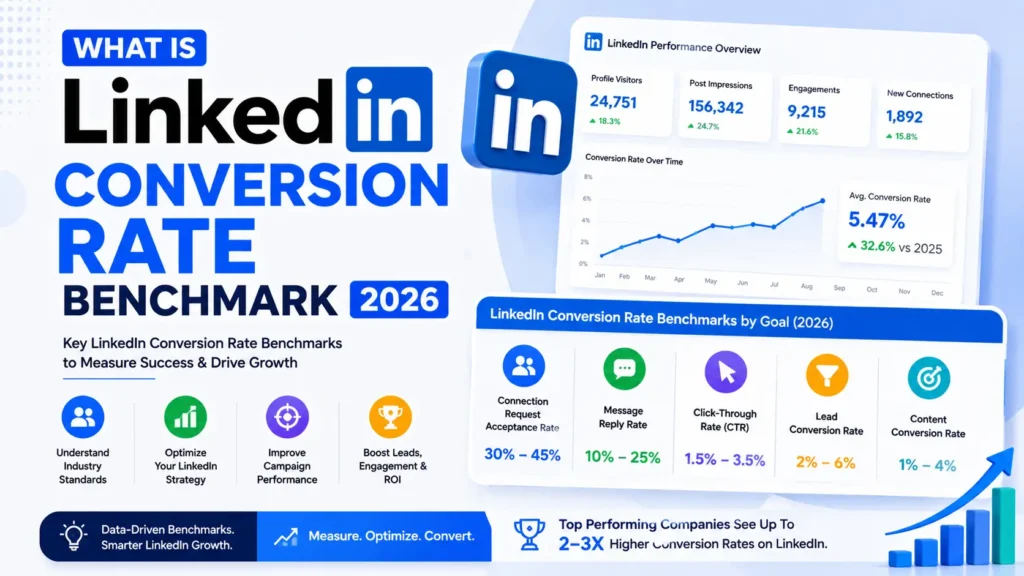
LinkedIn ads convert between 2% and 6.1% on average, but Lead Gen Forms hit 6 to 13% by eliminating manual form filling. Technology and SaaS companies lead all industries at 3.2% while real estate trails at 1.4%.
Obsessing over conversion rate alone is the wrong metric. A 2.74% LinkedIn conversion rate of qualified buyers generates more revenue than a 4.7% Facebook conversion rate of unqualified leads.
LinkedIn conversion rate benchmarker by Leads Monky — find out how your LinkedIn ad conversion rate compares to industry benchmarks.
What’s the Average LinkedIn Conversion Rate?
Let’s cut straight to what you want to know.
LinkedIn ads convert between 2% and 6.1% on average. But that number is basically useless without context.
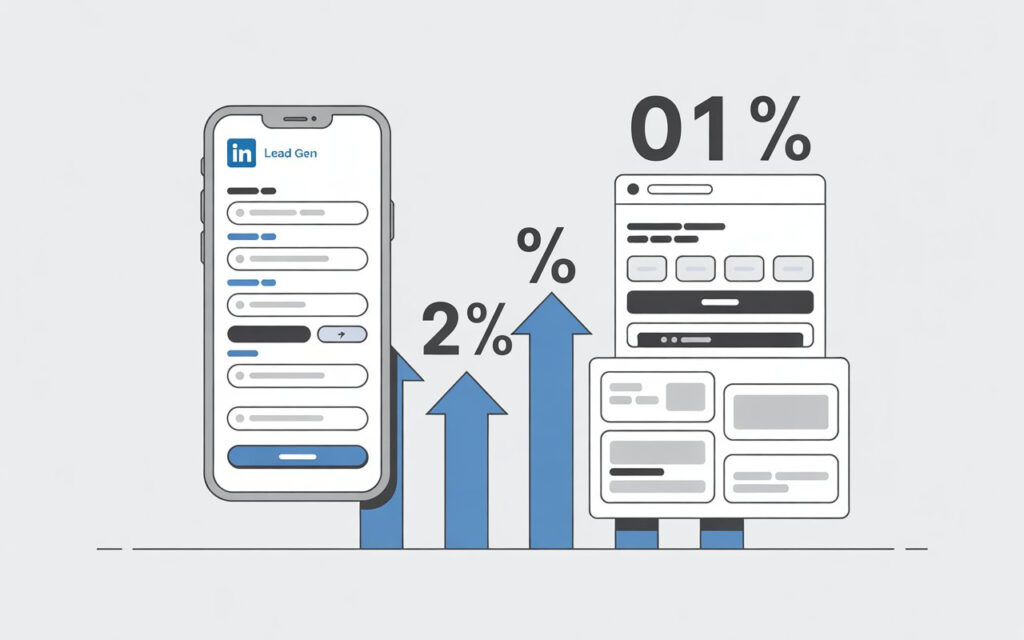
LinkedIn Lead Gen Forms are the real winner here, converting at 6-13%. Regular landing pages? They convert at a disappointing 2-5%.
That’s a 2-3x difference. Not a typo.
Here’s why that number changes so dramatically:
Your ad format matters. A lot. Sponsored Content performs differently than Message Ads. Video ads behave differently than text ads.
Your industry changes everything. Tech companies convert at 3.2% while real estate struggles at 1.4%.
Your region impacts costs and conversion rates. North America costs more but converts better. APAC offers the best bang for your buck.
Bottom line? Stop comparing yourself to generic benchmarks. Let’s get specific.If you want a deeper breakdown of industry-specific data.
LinkedIn Lead Gen Forms Average Conversion Rate
Here’s something that blows most marketers’ minds.
LinkedIn Lead Gen Forms convert at 6-13%. External landing pages convert at 2-5%.
Why the massive difference?
Lead Gen Forms are pre-filled with your LinkedIn profile data. Name, email, job title all auto-populated. One click and you’re done.
Landing pages make people type everything manually. On mobile. With autocorrect fighting them the whole way.
Less friction = more conversions. Simple.
But here’s the catch everyone misses: those Lead Gen Form conversions aren’t always higher quality. You get more leads, but they’re slightly less qualified.
When to Use Lead Gen Forms vs Landing Pages
Use Lead Gen Forms for:
- Ebooks and whitepapers
- Webinar registrations
- Newsletter signups
- Top-of-funnel content
Use landing pages for:
- Product demos
- Free trial signups
- Consultation requests
- High-ticket offers over $10K
Smart marketers use both. Lead Gen Forms build your list. Landing pages close deals.
2026 Benchmark Prediction for Lead Gen Forms
Here’s what to expect heading into 2026.
The average conversion rate for LinkedIn Lead Gen Forms will normalize to 8-11%. Still excellent, but not the 10-13% we’re seeing in 2025.
Why the drop? More advertisers are catching on. The format is becoming standard. Users are getting used to seeing these forms everywhere.
Top performers will still hit 12-15%. The secret? Better targeting, stronger offers, and fewer form fields.
If you’re already using Lead Gen Forms, optimize now before competition heats up.
LinkedIn Conversion Rate by Industry: Where Do You Rank?
Your industry matters way more than you think.
Tech companies convert at 3.2%. Professional services hit 2.5%. Real estate barely scrapes 1.4%.
Here’s why:
High-performing industries (Technology, SaaS, Financial Services) share something in common. Their buyers are already on LinkedIn researching solutions. They expect to see B2B ads for software and services.
Low-performing industries (Real Estate, Travel, Automotive) face a different problem. People don’t impulse-buy houses on LinkedIn. These purchases require in-person interactions, emotional decisions, and way longer sales cycles.
The Complete Industry Benchmark Breakdown
Technology & SaaS: 3.2%
Why it wins: Decision-makers live on LinkedIn. They’re actively searching for solutions.
Financial Services: 2.8%
Why it works: Professional buyers, high-value deals, strong purchase intent.
Professional Services: 2.5%
Why it’s solid: Consultants, lawyers, and accountants find qualified leads here.
Healthcare: 2.1%
Why it’s lower: Longer decision cycles, more stakeholders involved.
Real Estate: 1.4%
Why it struggles: Emotional purchases, needs physical visits, huge ticket prices.
Don’t panic if your industry has lower benchmarks. You’re competing within your category, not against SaaS companies.
LinkedIn vs Facebook Conversion Rate: The Paradox That Confuses Everyone
Here’s the LinkedIn paradox.
Facebook ads convert at 4.7%. LinkedIn ads convert at 2.74%.
So Facebook wins, right?
Wrong.
It’s like comparing a sports car’s top speed to a truck’s towing capacity. Different tools, different jobs.
LinkedIn leads close at 10-15% higher rates. They buy 30% bigger packages. They stick around longer with 40-50% higher lifetime value.
You get fewer leads from LinkedIn. But they’re worth way more.
The Real Math
Let’s run the numbers.
Facebook: 1,000 clicks × 4.7% = 47 leads × $2,500 average deal × 8% close rate = $9,400 revenue
LinkedIn: 1,000 clicks × 2.74% = 27 leads × $4,500 average deal × 12% close rate = $14,580 revenue
Facebook looks cheaper upfront. LinkedIn makes you more money.
This is why smart B2B marketers don’t obsess over conversion rates alone.To truly maximize results, you need a complete system—not just clicks and conversions. Here’s a detailed breakdown of how a high-converting LinkedIn lead generation funnel works:
http://leadsmonky.com/linkedin-lead-generation-funnel/
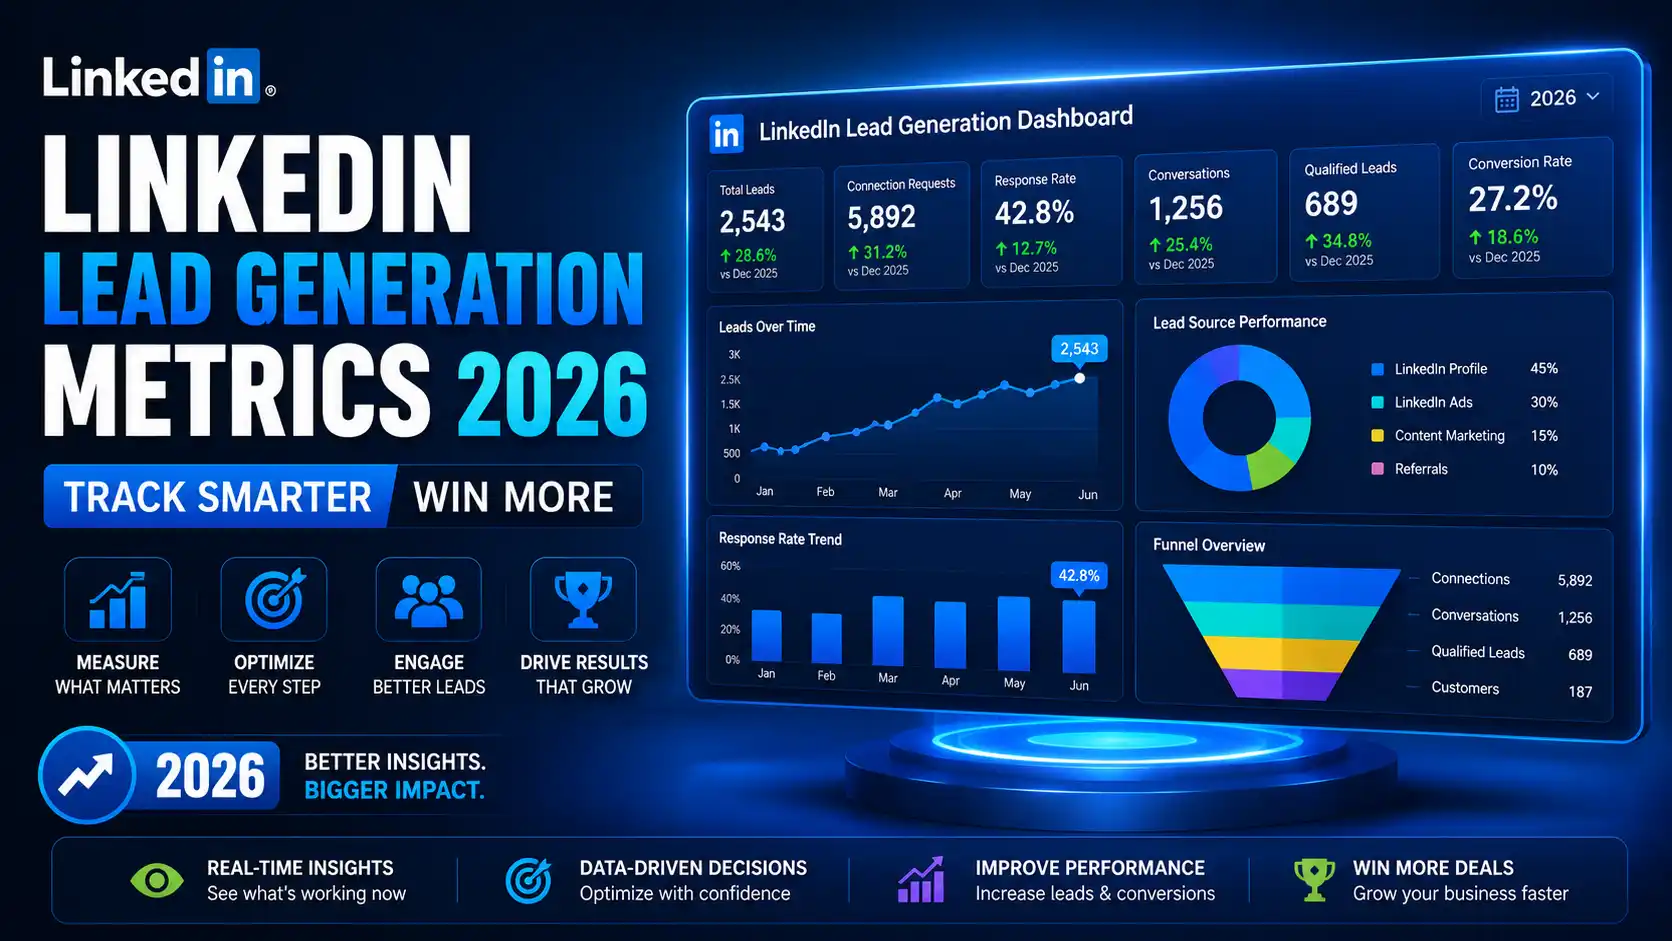
To truly evaluate performance, you also need to understand the LinkedIn lead generation cost, key metrics, and how they impact ROI. Here’s a complete breakdown of LinkedIn lead generation metrics in 2026:
http://leadsmonky.com/linkedin-lead-generation-metrics-2026/
Smart marketers track cost per customer and lifetime value instead
How to Improve Your LinkedIn Conversion Rate: 5 Tactics That Actually Work
Stop reading benchmark reports. Start implementing these proven tactics.
Before applying these tactics blindly, you should [A/B test your LinkedIn campaigns] to identify what actually works for your audience and maximize conversion performance.
1. Switch to Lead Gen Forms (Instant 2-3x Boost)
If you’re still sending traffic to landing pages for top-of-funnel offers, you’re leaving money on the table.
Lead Gen Forms convert 2-3x better and cost 25-35% less per lead.
Make the switch for:
- Content downloads
- Webinar signups
- Newsletter subscriptions
- Free tools or templates
Keep landing pages for demos and consultations where you need qualifying questions.
2. Cut Your Form Fields in Half (10-20% Lift Per Field Removed)
Every form field you remove increases conversions by 10-20%.
Most forms ask for 8+ fields. That’s insane.
You need: name and email. That’s it.
Everything else can be enriched later with tools like Clearbit or ZoomInfo.
Going from 8 fields to 3? You just doubled your conversion rate.
3. Layer Your Targeting Like a Pro (25-40% Improvement)
Most advertisers pick one targeting option. “Marketing Managers” and done.
Bad move.
Here’s what works: stack targeting criteria like Legos.
Marketing Managers + at 50-500 employee companies + in B2B SaaS industry + who’ve joined marketing groups.
You’re fishing in a smaller pond, but everyone in it actually wants what you’re selling.
Try it: add 2-3 targeting layers to your next campaign. Watch your conversions climb.
4. Lead with Results, Not Features (40-70% Better Performance)
Bad: “Our marketing automation platform has 200+ integrations”
Good: “B2B marketing teams using our platform generate 3x more qualified leads”
See the difference?
One talks about what you built. The other talks about what customers achieve.
Results win every time.
5. Test Video with Captions (50-80% Lift)
Get this: 85% of LinkedIn videos are watched with sound off.
If your video depends on audio, you just lost 85% of viewers.
Add captions. Keep videos under 60 seconds. Make the first 3 seconds stop the scroll.
Video ads with captions convert 50-80% better than videos without.
The LinkedIn Conversion Rate Truth Nobody Talks About
Here’s what drives me crazy about benchmark discussions.
Everyone obsesses over conversion rates. But high conversions don’t always mean high revenue.
Lead Gen Forms give you a 10% conversion rate. Amazing, right?
But if only 5% of those leads become customers, you just got 0.5% real conversions.
Landing pages give you a 3% conversion rate. Seems worse.
But if 20% become customers, you got 0.6% real conversions. Better.
This is why I focus on Quality-Adjusted Conversion Rate.
It sounds fancy, but it’s just common sense. Multiply your conversion rate by your lead-to-customer rate, then factor in average deal size and cost per click.
Facebook might give you a 5% conversion rate of garbage leads. LinkedIn gives you a 2.7% conversion rate of qualified prospects who actually buy.
LinkedIn wins when you do the math right.
What to Expect LinkedIn Conversion Rate Benchmark in 2026: Prediction
The landscape is shifting fast. Here’s what’s coming.
Thought Leader Ads are crushing it right now with 10-20% CTR. But as more brands adopt them, expect that to normalize to 5-10% by Q4 2026.
Lead Gen Forms will plateau at 8-11% average conversion rate as market saturation increases.
AI-powered optimization will become standard. LinkedIn’s algorithms are getting scary good at finding your best prospects.
Multi-touch attribution will finally become common. You’ll see LinkedIn’s true impact including all the deals it influenced but didn’t get last-click credit for.
Smart marketers are already testing AI-generated creative and personalized video ads. Early movers will have a 12-18 month advantage.
Your Next Steps: Stop Benchmarking, Start Improving
Here’s what actually matters.
Your conversion rate compared to last month. Not compared to some industry average from a report.
Are you improving quarter over quarter? Then you’re winning.
Here’s your 30-day action plan:
Week 1: Switch appropriate campaigns to Lead Gen Forms
Week 2: Cut form fields to 3-4 maximum
Week 3: Layer 3+ targeting criteria for precision
Week 4: Test video ads with captions
Don’t try to hit some arbitrary benchmark. Focus on continuous improvement.
Because the marketers who win aren’t the ones with the highest conversion rates. They’re the ones who keep testing, keep optimizing, and keep moving forward.
LinkedIn remains the most powerful B2B advertising platform in 2025. But only if you measure the right metrics and optimize relentlessly.
Now stop reading. Go fix your forms.